Renewable Energy Market
Increasing Electricity Production
According to Bloomberg New Energy Finance, spending on renewable energy capacity is expected to total $7 trillion over the next 20 years. Limited conventional fuel supplies, growing demand for energy, advances in technology, continuing climate change, and improving price competitiveness between traditional and renewable energy sources are expected to drive the continued growth of renewable energy for years to come.
Source: 1,2 Bloomberg New Energy Finance, November 16, 2011; 3 Bloomberg New Energy Finance, April 22, 2013
SEIA Report Reveals That 36% Of All New Electric Capacity In 2014 Came From Solar
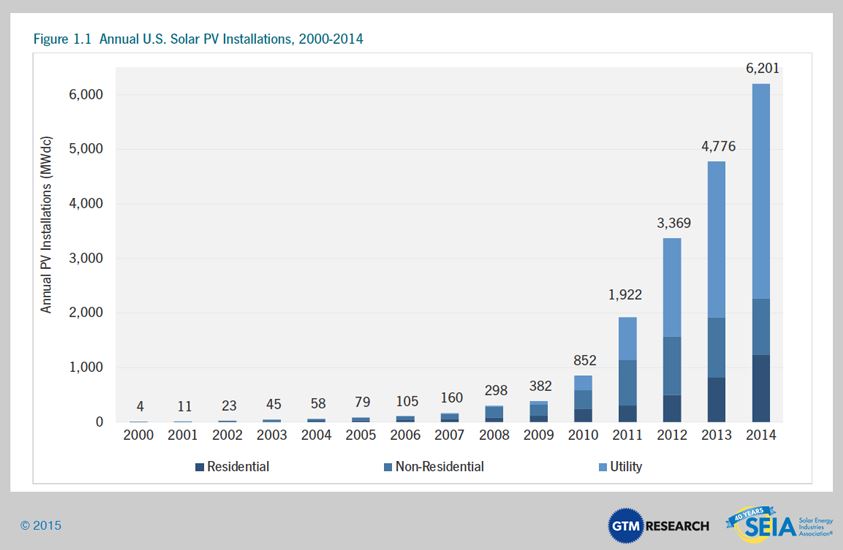
Q3 2014 represented the second largest quarter ever for solar installations in the U.S., with installed photovoltaic (PV) capacity topping the gigawatt mark for the fourth consecutive quarter to settle at 1,354 megawatts (MW). This performance represents 41% growth over Q3 of last year and brings cumulative installed solar capacity to 17,500 MW. With nearly 600,000 solar installations through Q3, the U.S. solar industry is on pace to complete its 1 millionth installation in 2015. Through Q3, 36% of all new electric capacity installed in 2014 has come from solar. (All data from SEIA/GTM Research “U.S. Solar Market Insight: Q3 2014” unless otherwise noted.)

Installations Continue to Boom
- There are now over 17,500 MW of cumulative solar electric capacity operating in the U.S., enough to power more than 3.5 million average American homes.
- With over 49,000 installations in Q3, nearly 600,000 U.S. homes and businesses have now gone solar. Through Q3, a new solar project has been installed every 3 minutes in 2014.
- Growth in Q3 was led by the residential sector, which grew 58% over Q3 2014, and the utility-scale sector, which installed over 800 MW for the 3rd time in 12 months.

Projections for Solar Electric Market
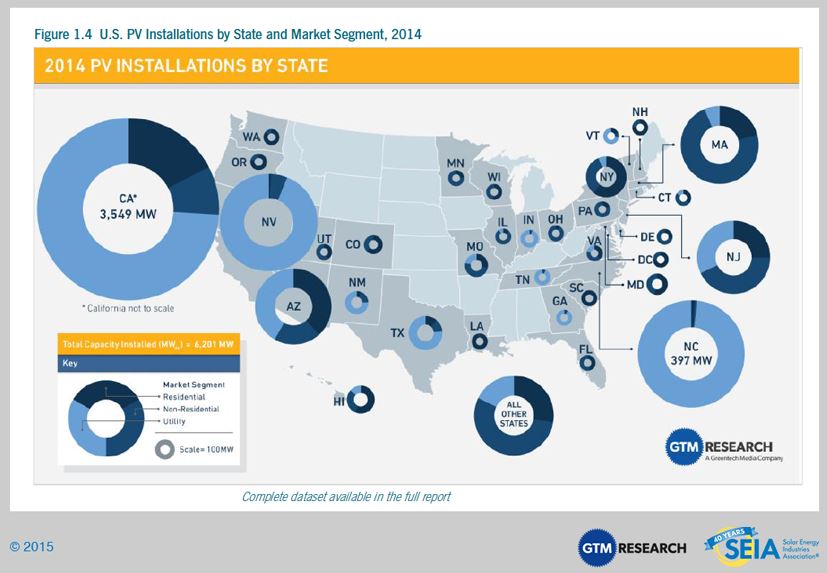
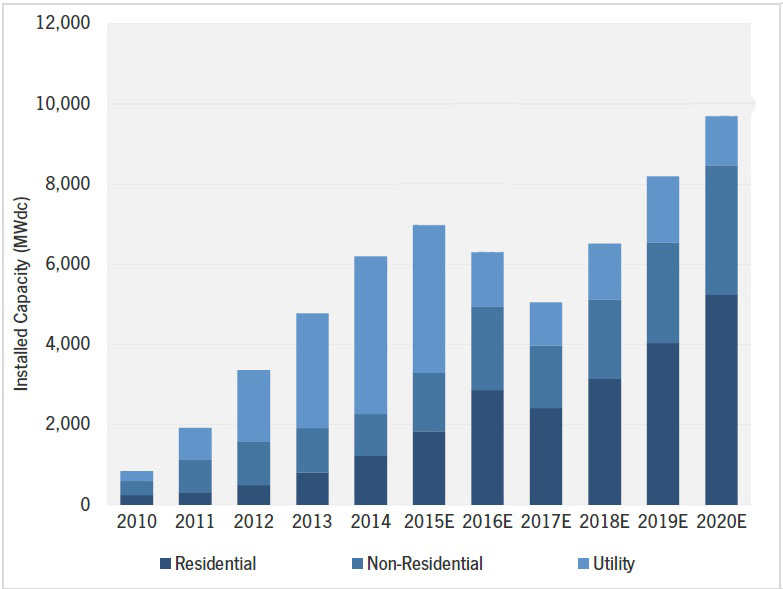
Although the distributed generation market has grown by impressive strides, the primary backbone of US demand continues to be utility Photovoltaic (PV). More than 10 gigawatts of utility PV earned Power Purchase Agreements (PPAs) between 2010 and 2012 alone, thanks to a wave of aggressive procurement driven state led Renewable Portfolio Standards (RPS). This contracted pipeline is finally becoming realized, and the outlook for PV remains stronger than ever as contracted capacity continues to outpace capacity brought on-line in primary markets (California and North Carolina are leading the industry) and secondary markets as well (Georgia, Minnesota, Texas, Utah, and Colorado). Commercial markets along with residential markets will also realize a significant increase in installations.


